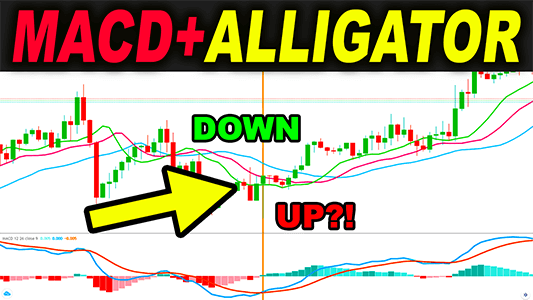
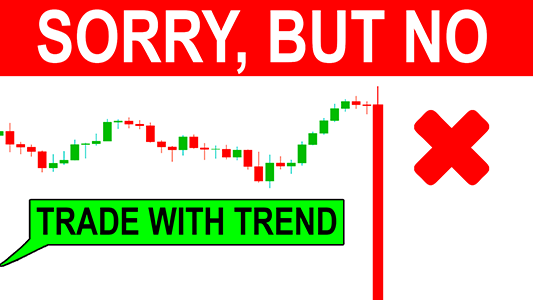
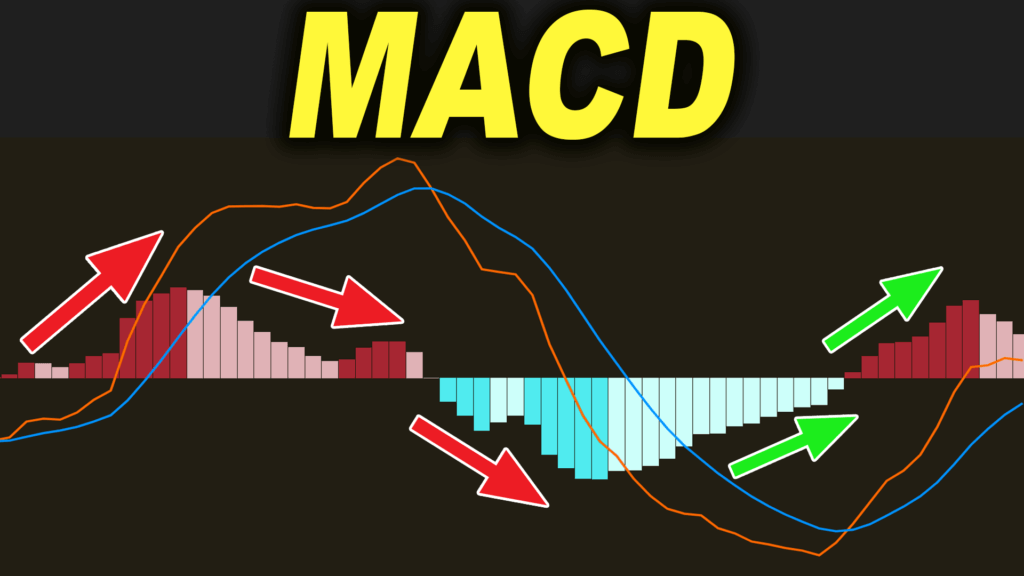
Do you want a high win rate in day trading? Strategies like the MACD trading strategy got very high win rates when we tested them 100 times. But if you want to really make money in trading, you should not take every MACD or any other entry signal, especially when the market looks similar to the one I’m about to show you. What do you see on this chart? Price is in an uptrend? If the price is going up, should you take a long position as a day trader? In this video, I’m going to show you how and why I went in the opposite direction of the MACD and VWAP indicator, and how price made a move exactly how I anticipated. If you don’t know much about the VWAP trading strategy and MACD strategy that we tested 100 times, check out the MACD and VWAP videos on the Trading Rush Channel.
On this daily chart, price is in an uptrend. And for the last 4 days, the price has opened with a gap up, and closed higher. This means that there is a lot of buying pressure. But if you have been trading for a while, you already know that price does not make a big move every single day. Unless there is an event, the probability of price making a big move in one direction is really low. In a day, price moves a certain amount. On this chart, there was an event on this day, and a big candle was formed. But if you look at other daily candles, they move approximately 200 points up or down. In other words, price usually makes a move between 100 and 250 points approximately in a single day. Today, the price opened with a gap up. Furthermore, the distance of the gap was around 140 points. Also, on this chart, the 15000 mark was a resistance area. Yesterday, the opening price was around 14950, and the closing price was around 14924. And at one point, it touched the 15000 resistance mark. When the price made a move near the 15000 mark, the selling pressure was increased and the price made a move down. But today, the asset opened above the resistance level. If you have watched the How I got 70 percent win rate in Trading Video, you know that price breaking the resistance level can be a big deal. If you don’t know what I’m talking about, check out that video on the Trading Rush Channel.
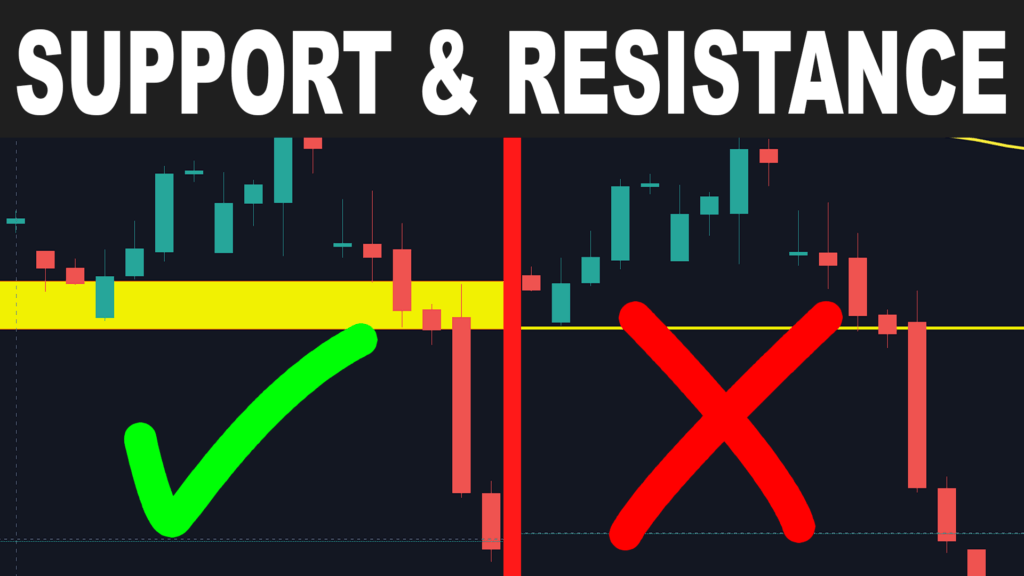
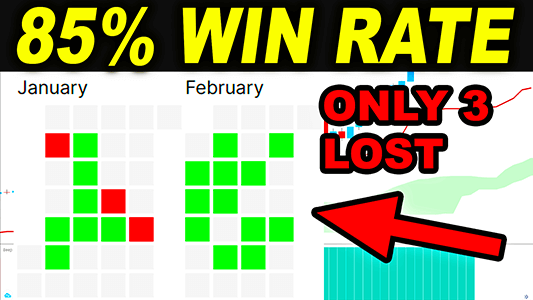
After the gap open, price made a move up. It made an upward move of around 50 points. But you remember, earlier we saw that price opened with a gap of approximately 140 points, and in a day, price makes a move of around 200 points on average. So right now, there is a good chance that the price is near the top of this upward move. But taking trades blindly using this information is a stupid idea. In the last video, I said I have won 7 out of 10 days in the month of January. In this month, I have had another 3 green days, with 2 trades still running. Since I trade options mostly, while analysing the option chain data to adjust the two running trades, I noticed that the long positions have increased on the 15000 and 15100 level. In other words, many people are expecting the price to stay above the 15000 and 15100 level. After doing option chain analysis, I noticed that the 15150 was a resistance area. I’m going to explain how to find support and resistance levels, and how to analyse the price movement with the option chain in a future video. So maybe subscribe to the Trading Rush Channel and Ring the notification bell to see that. Since the price is already at the high of its average range, I was expecting for the price to reverse from around the 15150 mark, and close somewhere around 15100. Since the price was trading around the 15110 mark, I waited for the price to go near the 15150 resistance. If you watched the MACD trading strategy video, you will notice that MACD is already giving an entry signal. But like I said, since the 15100 price mark will act as a support, selling on the support is a bad idea.
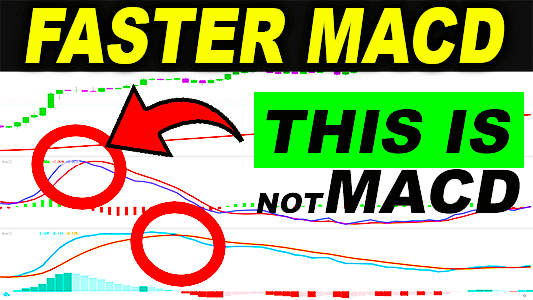
If we fast forward a bit more, you will notice that the 15100 level is acting as a support level. Furthermore, price is now moving in a range. Now, in one of the MACD videos, I explained how the MACD is calculated using a cat example. If you have watched that MACD video, you will probably notice that, similar to the cat, price is losing its strength to move higher. After a couple of minutes later, the price was still in a range. Since we already knew the 15100 level was a support, we didn’t take the MACD signal when the price was near the support. But if you look at the MACD signal now, you will notice that it is about to give a long entry signal. But taking a trade using an indicator like MACD right now, is a really bad idea. The reason is simple, MACD is a momentum indicator, and right now price is in a range. Trend Following trading strategies will give false entry signals in a range. But since price was in a range for a while, the 15100 level will act as a strong support now. And if price breaks below it, or in other words, if the price gives a breakout below the strong support level, there will be a good selling pressure.
At first, I was waiting for the price to come up near the resistance. But when price broke below the strong support level, the short entry was on a call option. Since most viewers of this channel are Forex traders, I won’t go into detail on how stock options work. Just remember that this call option will move similar to this. I wanted to set the stop loss right here, but since the price was near the V WAP line, the stop loss was set above the swing high. If price moves higher from the VWAP line, the stop loss is far away.
Right now, we are taking trade in the opposite direction of two indicators. First is the MACD indicator, and second is the VWAP indicator. MACD indicator can show a buy signal, but since price was in a range, this buy won’t be valid. And since price has broken from a strong support, I’m expecting the option price to cross below the VWAP line. If the price moves higher after an increase in buying near the V WAP line, the stop loss is set far away. And since the 15050 was a weak support according to the option chain analysis, and the price opened near that level, it can act as a good support area. So the profit target was set above it.
And if we fast forward a bit, you will see that price made a good move down after breaking the 15100 support level. On the options chart, only one green candle was formed near the V WAP line, and the price made a good move down, and the profit target was hit. Furthermore, if we fast forward a bit more, you will see that the price reversed exactly from where we expected it to.
First we saw that on average the price was moving around 200 points up or down in a day. But we didn’t take trades based only on that. We analyzed the potential support and resistance areas using the option chain. Since we found out that the price was near a support, all sell signals were ignored. When price broke below the strong support area, the entry was in the downward direction against the indicators, because we already know that not all indicators work well when the market is moving sideways. And the profit target was set above the next support, and the profit target was hit. Furthermore, the price reversed from the support level and made a move just like we anticipated. This will be another green day of this month. So if you find yourself in a situation, where the chart looks something like this, where the price has already made a good move in the upward direction, and the price is near the top of its daily average range, it is good idea to look at other things before blindly buying at the top of the trend.
That’s all.
Read more
Want To See My 4 Steps 77% Win Rate Trading Strategy? (With Data)

See What I'm Trading Right Now?
1. Price Action Series (43mins)
2. Trading Foundation Series (1 hour)
3. How I Made 100% Profit In A Year (2 hours)
so You can Increase Your Win Rate!


Want To See My 4 Steps 77% Win Rate Trading Strategy? (With Data)
See What I'm Trading Right Now?
1. Price Action Series (43mins)
2. Trading Foundation Series (1 hour)
3. How I Made 100% Profit In A Year (2 hours)
so You can Increase Your Win Rate!