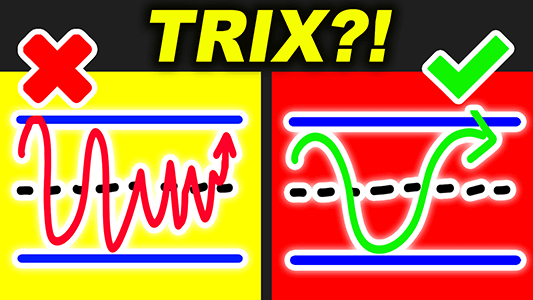
I took two trades with the VWAP indicator, and both of them made a profit! The first one was a quick one, I took this trade on the 2 mins time frame. Since VWAP is an intraday indicator, it’s not very useful on the higher timeframes. Here, price is in a downtrend, and when I opened the charts, price was near the VWAP line. On this chart, this blue line is the VWAP indicator. If you have watched the VWAP strategy video on the Trading Rush Channel, you know that price is expected to bounce back near the VWAP line. So we are looking to go short near the VWAP line, only if there is a sign of reversal.
In this case, I’m looking for reversal candlestick patterns near the VWAP. Note, I’m looking at the Futures price, and the Futures VWAP line to analyse the trade. But I’m going to trade the options of the same, instead of directly trading Futures, because Trading Options is cheaper than Futures.
As you can see, smaller candles are forming near the VWAP line. When this red candle was forming, I took a short position, by buying the put option. I got in around 96.55. After taking the trade, Price tried to cross the VWAP line, but failed to do so. This can confirm a selling pressure near the VWAP, but I’m not expecting price to move strongly in the downward direction. So I will try to book profits, when future price comes near this level. As you see, the price is struggling to go higher, but if it crosses and makes a big candle above the high, and above the VWAP line, I will close the trade. But the price made a move down after touching the VWAP line, and when the option price went up near the 100 mark, I closed the trade. Unfortunately, I got filled in at a lower price, so the profit was lower than I expected. But profit is still profit, and this profit will add little bit to the bigger weekly and monthly positions. At the end of this month, I will probably show the number of days I made money in this month. So maybe subscribe and ring that notification bell to see that.
After booking profit on this trade, price reacted from the area where we drew the line. Price made a move up, and crossed the VWAP line. Now, price has made a higher swing high, and is above the VWAP line. Furthermore, if price comes down near the VWAP, VWAP will act as a support, but now the previous swing high will also act as a support. As you can see, price had a rejection from above, and is coming down near the VWAP line, and the previous swing high support. I’m looking for any entry signal, especially a long candle pattern near these two levels.
When the green candle engulfed the previous red candle, I sold the Put Option. Remember, in the last trade, I bought the put option, but this time, I’m selling the put option to enter the trade. If the price goes up, this put option will go down, and we will make money.
If the futures price crosses below the VWAP line, and below this red line I drew, I will close the trade and book the loss. I’m expecting for the price to move up inside these two blue lines I drew.
After taking the trade, the price didn’t move much, and went sideways. It stayed above the VWAP line and above the support level. If we fast forward a little bit, you will see that price went up, and had a big rejection from above.
This happened quickly, so I couldn’t close the trade, when the options price went down. So I created an open limit order at 84.20. And if the price makes a sudden move down, hopefully the entire order will get filled.
If we fast forward a little bit, we will see that the futures price made a sudden move down, but still not below the support and VWAP line. Then, there was buying pressure and the price made a sudden move up.
If we fast forward more, you will see that price made a move up, and the option price made a move down. This time, the option price went down enough, and the profit target was hit. So both of the VWAP trades were profitable today!