There are three kinds of traders in the forex and stock market. The ones who use indicators like Bill the second, the traders who trade by looking at only the price action, and the ones who look at fundamentals before taking the trades. Let’s say the fundamental trader was expecting the price to move in the upward direction because of an event. According to the fundamental trader, any pullback or discount in this upward move is an excellent buying opportunity. The price action trader sees an uptrend pattern, and the indicator trader uses a moving average like the 200 period moving average and comes to the same conclusion that the price is in a good uptrend, and any pullback is an excellent buying opportunity. Now let’s say, Bill the fundamental took a trade when the price was right here. According to his research, the price is expected to bounce back up. And let’s say price does start to go in the upward direction. Let’s say Bill the fundamental is right, and this is the end of the pullback. Maybe there is some kind of event that will have a positive impact on the market. Bill the first who is a price action trader, sees that the price is making an upward move, and enters the trade when the price makes a higher swing high and higher swing low pattern. On the other hand, since Bill the second is an indicator trader who likes to trade in the direction of the long-term trend, he uses a trend following trading strategy like the MACD strategy. If you look closely, this scenario is quite similar to the traffic scenario we saw earlier.
In the traffic scenario, all three kinds of drivers made a similar decision. In this scenario, all three kinds of traders also made a similar decision. And you can say that this reversal point is like a roadblock. In the strategies tested 100 times series, I tested many different trading strategies 100 times. But in most of those videos, I recommended setting the stop loss using the pullback. The MACD strategy that got a 60 percent approximate win rate after testing 100 times, also used the pullback stop loss.
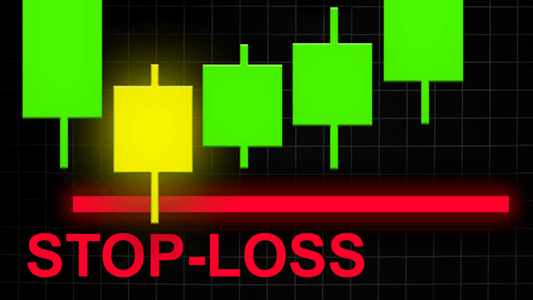
In an uptrend, if the price gives a pullback, and you enter near the end of the pullback, setting the stop loss below the pullback is a really good idea. Now if you set the stop loss below the pullback it doesn’t mean that it won’t get hit. Trading is a probability game. Nothing is 100 percent. Price can break the pullback support and hit your stop loss, but if you set your stop loss below the pullback, the price will have a difficult time crossing it.
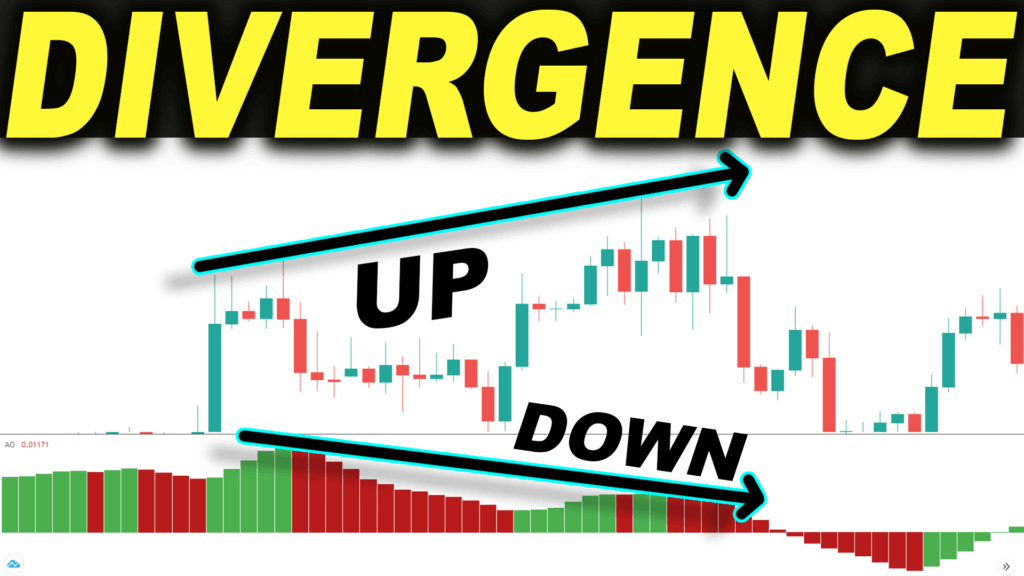
In the second scenario, Bill the second who used the MACD trading strategy that got a high win rate on the Trading Rush Channel. The MACD indicator is a momentum indicator, and in an uptrend, we use the MACD trading Strategy to find the end of the pullbacks. In simple words, we look at the MACD indicator to see if the downward momentum of the pullback is decreasing or not. In the second scenario, the entry according to the MACD Trading Strategy was right here.
And even though an indicator trader like Bill the second, who didn’t know the reason why price reversed from this area like Bill the fundamental did, by setting the stop loss below the roadblock, he has unknowingly increased the probability of winning even more. If you have watched some of the latest videos on the Trading Rush Channel, you know I had a high win rate in the last two months. Some of those trades I shared in the form of a live trading video. If you have watched those videos, and if you are supporting Trading Rush on Patreon, you already know that I usually set the stop loss below or above the pullback.
Since the MACD video was uploaded on the channel, many have emailed me saying that they are getting a better win rate with the MACD Trading Strategy than they used to get with their previous strategies. You probably heard someone say that trend is your friend, and you should always trade in the direction of the trend to have a higher probability of making money. One of the reasons the MACD Trading Strategy got a high win rate, was because it gave entry signals in the direction of the trend. Furthermore, MACD strategy tries to give an entry signal near the end of the pullback. And since I used the pullback stop loss while testing, it got a 60 percent approximate win rate when we tested it 100 times.
Someone will say “Indicator Strategy is not good, and price action is the only way to make money”. But in reality, there are people who trade with no indicators and make money, there are traders who use indicators and make money, and there are people who do fundamental analysis and make money, and amateur traders end up arguing that one is better than the other. One is not better than the other. One can make money without using an indicator, and one can make the same profit with an indicator. If you tell a lawyer to do an operation and tell the doctor to go to court, the end result probably won’t be good. MACD crossover was nothing special, MACD is just an indicator that is showing the increasing and decreasing momentum. But if you use it in the right place, it will do wonders for you.
Furthermore, combining indicator strategy with the price action can significantly increase the overall win rate in trading. Since the start of this year, I have shared 18 live trade analysis on Patreon, and 12 of them reached the profit targets. Most of the trades had a 1.5 to 1 Reward Risk Ratio, and some trades had a 1 to 1 reward risk ratio because there was a support resistance nearby. So in the last two months, the live analysis I did on Patreon had a win rate of 66 percent. And in the stock market, the win rate I had was more than 70 percent. The point is, combining indicator strategies with price action got me a high win rate in trading, so you can give it a try as well if you want. I have already talked about how I find charts and analyze setups on this channel, and on the Trading Rush Patreon Page. Check them out if you want. Just remember that just because I or someone else got a high win rate by combining price action and indicator strategy, doesn’t mean everyone will get the same win rate. With an indicator strategy, there is a good chance that everyone who trades with it will get a similar win rate. But the win rate with a price action strategy will depend on how good you are at identifying the price patterns. Trading is a game, where an impatient trader loses money, and the patient person makes more money.
This is a normal trading chart. But if you look at the reversal points as a roadblock, you will probably notice some of the important price levels. In this uptrend, the price went in an upward direction and then gave a pullback. When the pullback was over, MACD gave a long entry signal. In this setup, we would have entered near the MACD signal and would have set the stop loss below the pullback. Why below the pullback? Well, because it looks like price found support at this price area. In other words, a roadblock. Since this is an uptrend, the price can move in an upward direction after this pullback. When that happens, this trade will make a profit. If it does not move in the upward direction, the stop loss will be hit and we will book the loss.
In this example, the price made a move up. Then gave another pullback. Near the end of this pullback, MACD gave another long entry signal. Again we will enter at the MACD signal, and set the stop loss below the pullback. As you can see, the price made a move in the upward direction.
Now if you find easily identifiable roadblocks, or in other words, if you find reversal points that are easier to spot, you will notice that these price areas act as strong support and resistance areas.
On this chart, we can see that price reversed from these 6 price points. And if you scroll a little bit to the right, you will see that after making a move down, the price came back up and these price points were acting as a strong resistance. Price reversed from this resistance area and made a move down. Then it came back up and reversed from the resistance area again. Price reversed from the resistance area, not one, not two, but three times before finally breaking above it.
Setting the stop-loss below the pullback in an uptrend is like setting the stop-loss below a support level, and setting the stop-loss above the pullback in a downtrend, is like setting it above the resistance level. One of the first things we learn as a beginner trader is that price has a higher probability of reacting from the support and resistance areas. By setting the stop loss below or above the pullback, we can decrease the chances of price triggering the stop loss, and increase the probability of winning.
That’s all!