Why is the CCI indicator so different? Some people use it to find over-bought and over-sold zones, and some use it to find direction of a new trend. What method is the right one? How to use the CCI indicator properly without blowing up our accounts? Lets find out.
CCI is one of the popular and best indicator out there, It can even increase the win rate of your strategy if you use it properly. But that’s the problem. There are two different trading strategies based on this one indicator. When Donald Lambert created the CCI indicator in 1980, he used it to find strong trends in the commodity market. Hence the name, Commodity Channel Index. But since the creation of the CCI indicator, market has changed. Traders have adapted this indicator to use on all kinds of markets and all time frames.
Now, there are two kinds of traders that use the CCI indicator in very different ways.
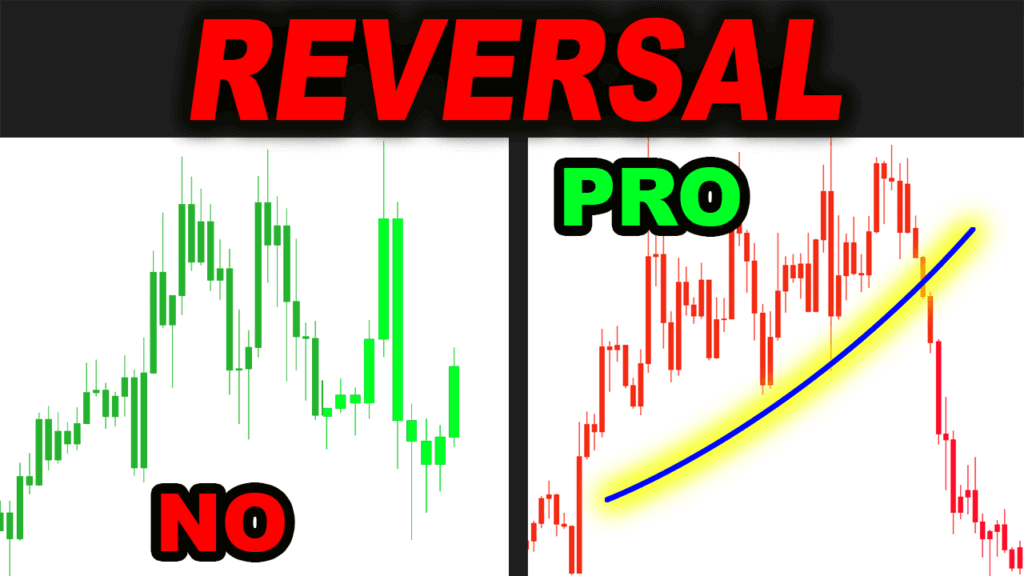
Some, still use it to find the strong trend. And some use it to find the reversals.
In this video, we are going to take a look at both of these methods. As always, I will also test the CCI indicator 100 times, to find its real win rate, and to make sure it works. But i will do it in a separate video. SUBSCRIBE to see it. I have already tested MACD, RSI, and other indicators 100 times, to find their real win rate. Check those videos out if you want. After all, you don’t want to risk your money on a strategy that doesn’t even work.
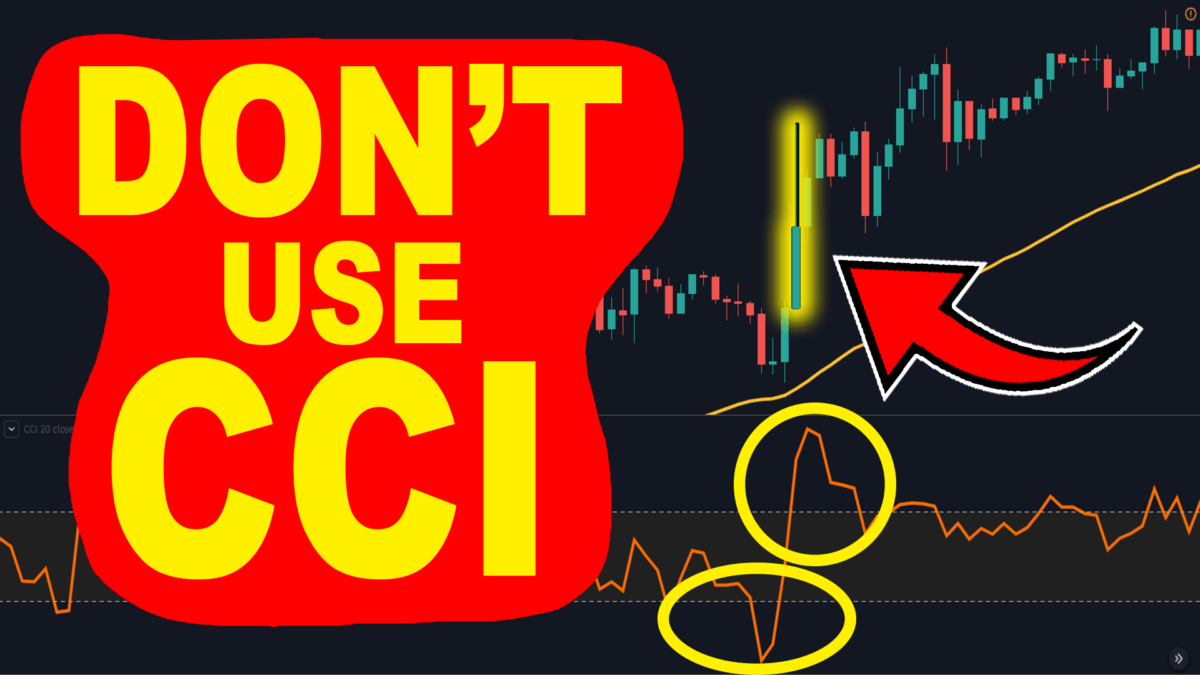
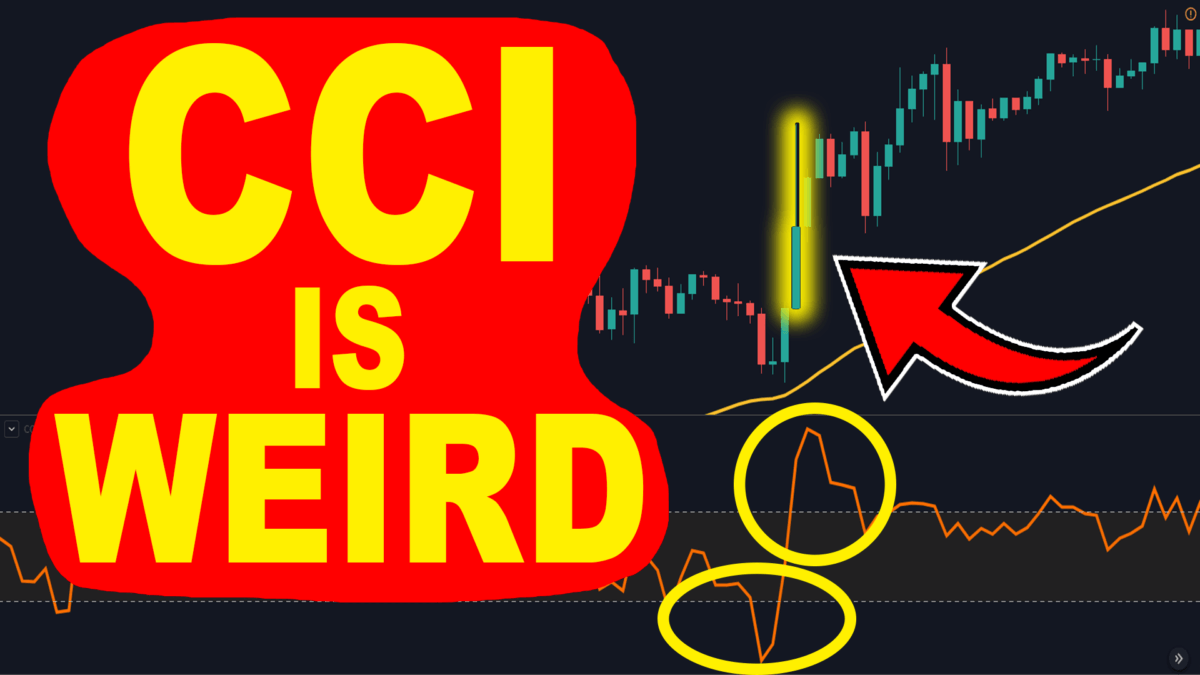
This is how the CCI indicator looks like. On first look, it looks like the RSI indicator, but it is very different.
On trading view, The CCI indicator will come with an orange line, called the CCI line. And two horizontal lines, called the Upper band, and the lower band.
The two trading strategy based on this indicator are really simple. Lets start with the first method.
This is the method that Donald Lambert, the creator of this indicator used.
When the CCI line, crosses above the positive 100 line, in other words, the upper band. It can indicate the start of a strong uptrend.
And if the CCI line, crosses below the Negative 100 line, in other words the lower band. It can indicate the start of a strong downtrend.
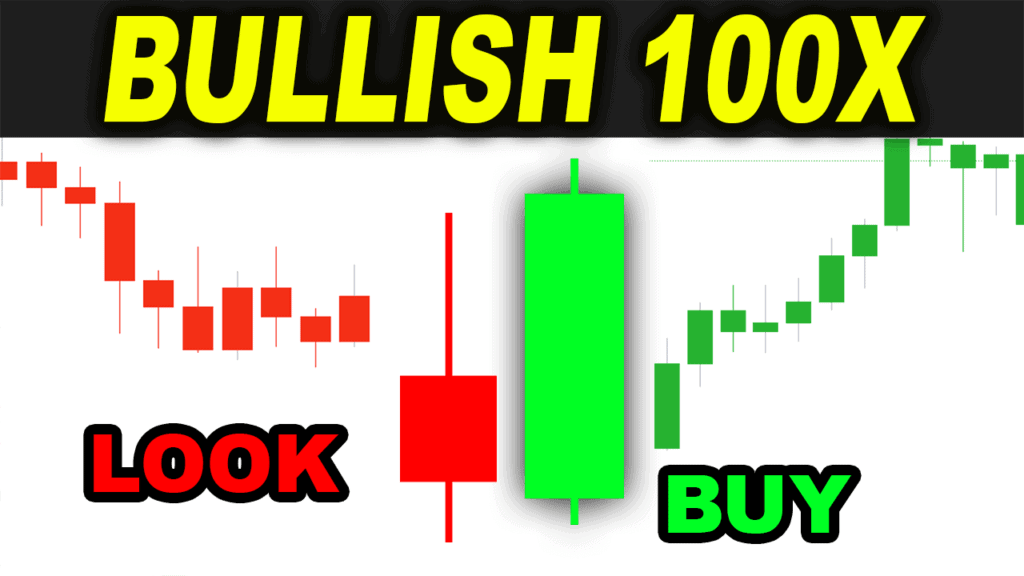
In simple words, CCI line crossing above the upper band, is a buy signal. And CCI line crossing below the lower band, is a sell signal.
Here’s an example.
As you can see, when the CCI went above the upper line, the market gained momentum, and a strong uptrend took place.
Similarly, When the CCI line crossed below the lower band, the market started a strong down trend.
You can enter trades, as soon as the CCI crosses above or below the bands. But you will get a lot of false signals, if you use the CCI indicator only. Use it with something else.
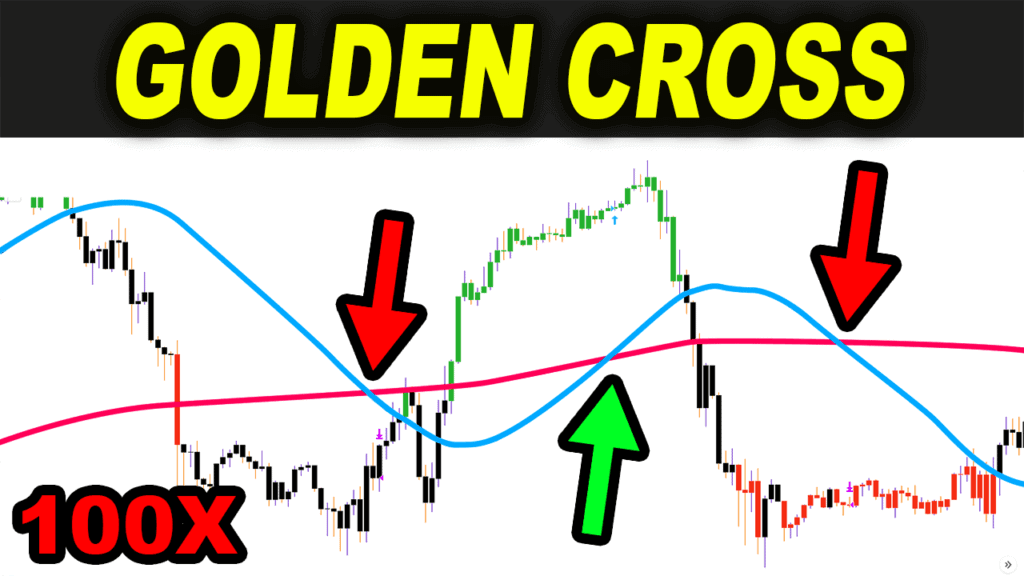
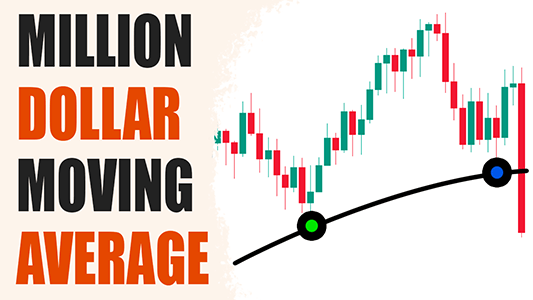
This method is best used in a trending market. And if you have been following this channel for a while, You know, to find the direction of the long term trend, we use the 200 moving average.
If price is above the moving average, we will only look to buy. This will help us avoid false sell signals. Similarly, if price is below the 200 moving average, we will only take sell signals. This will help us avoid false buy signals given by the CCI indicator.
So our modified CCI trend trading strategy, goes something like this.
We will buy, when CCI crosses above the upper band, and price is still above the 200 E M A. And we will sell, when CCI crosses below the lower band, and price is still below the 200 moving average.
If you want to know about the Best MACD Trading strategy, that i back tested 100 times, to see if that strategy is profitable or just fake, check out the first video on this channel.
And check out other strategies that i tested 100 times.
Like the video if you liked it.
and subscribe for more trading videos.
Don’t forget to ring that notification bell as well.
Thanks for watching.