Tag: stocks


Categories
5 BIG Moving Average Strategy MISTAKES
- Post author By Trading Rush
- Post date July 6, 2020
Moving Average Trading Strategy Mistakes Beginner Stock Traders and Forex Traders make in Intraday Trading / Day Trading, Swing Trading. Avoid these and learn the best trading strategies to make money in trading!
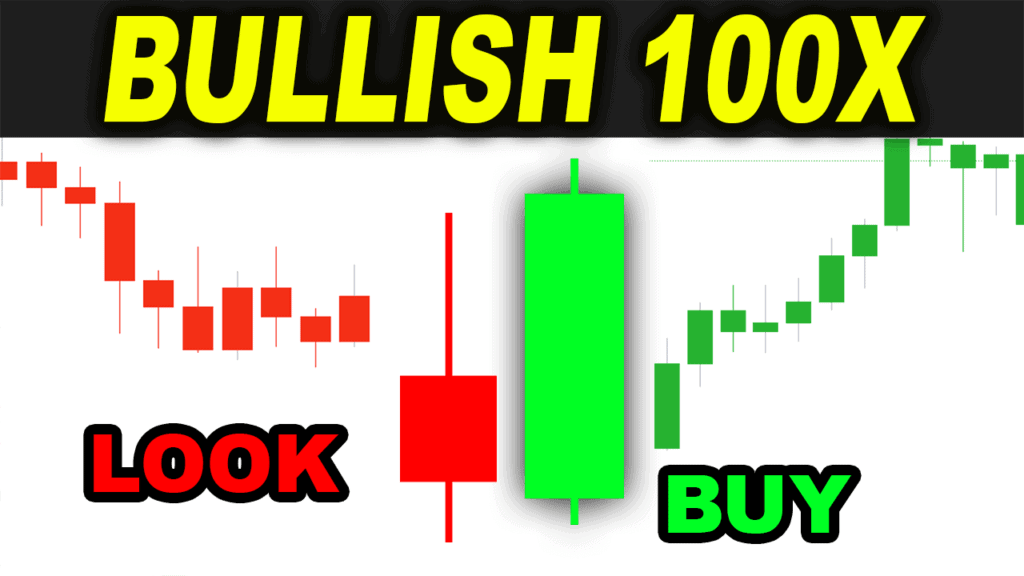
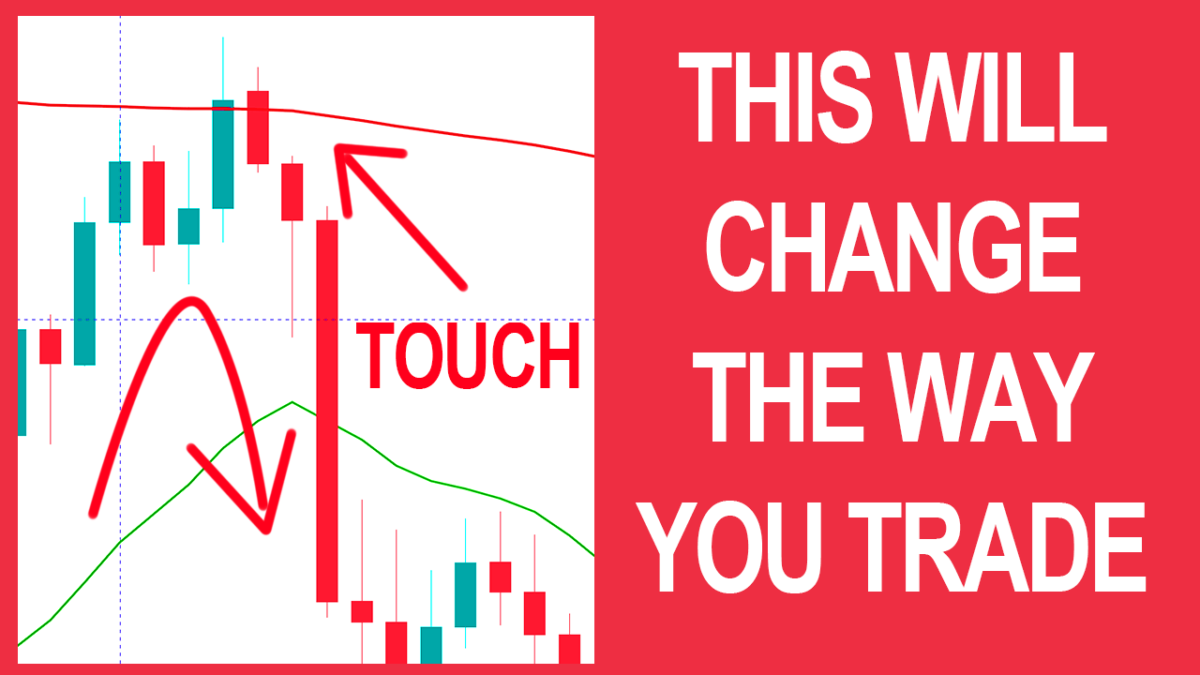
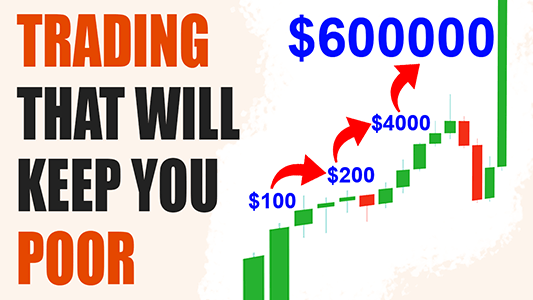
Who doesn’t want to turn thousand dollars to hundreds of thousands of dollars? before i started making money in stock and Forex trading, this is what my charts used to look like. this trading setup is absolutely garbage. there are better ways to use moving averages for trading! Today, I will show 5 Moving Average Mistakes, You Should avoid, to make more money, than you ever could. Number 5, taking trades on every pullback near a moving average. A lot of new traders, make mistake of taking trades, as soon as the price touches their moving average. #movingaverage #trading #tradingstrategy
Yes, moving average acts as a support and resistance, but not every time. Stock market, and Forex Market, are not your servants, to follow your rules. Market can go straight through your moving average, and change direction of the trend anytime.A better strategy, is to wait for the market to create sell or buy signals. Then and only then, you should enter a trade, with a proper stop loss. This is a game where the impatient person loses money, and a patient person makes more money. Hold your horses, and wait for the right entry signal near the moving average.Number 4, not understanding the difference between Exponential moving average, and simple moving average.Moving average is a lagging indicator. And it can be really bad for you in certain situations.
They don’t take future price movements, events, and high low demands into consideration. If you are day trading, it is a good idea to use Exponential moving average, instead of using simple moving average. That’s because Exponential moving Average will react to sudden price movements quickly, than the slow Simple Moving Average ever will. Third mistake, is trading a flat Moving average. If you find a moving average line looking flat, or in other words, horizontal on a chart, it is an indication that there is no trend going on. Market is not trending and is in a range.If you are using a moving average, you are most likely a trend trader. Remember, trend is your friend. The big market makers move the market, your impact on moving the market is almost null.
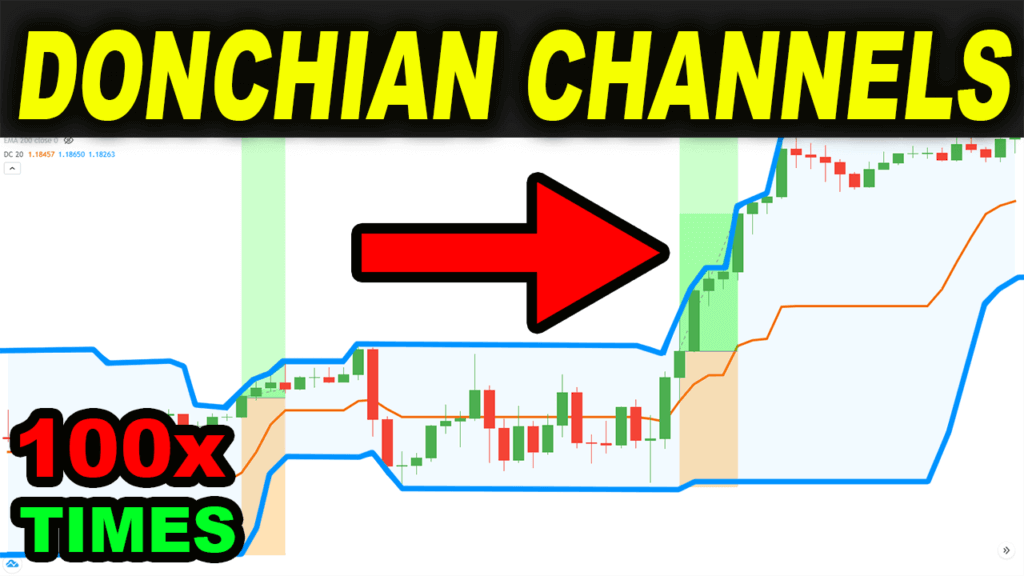
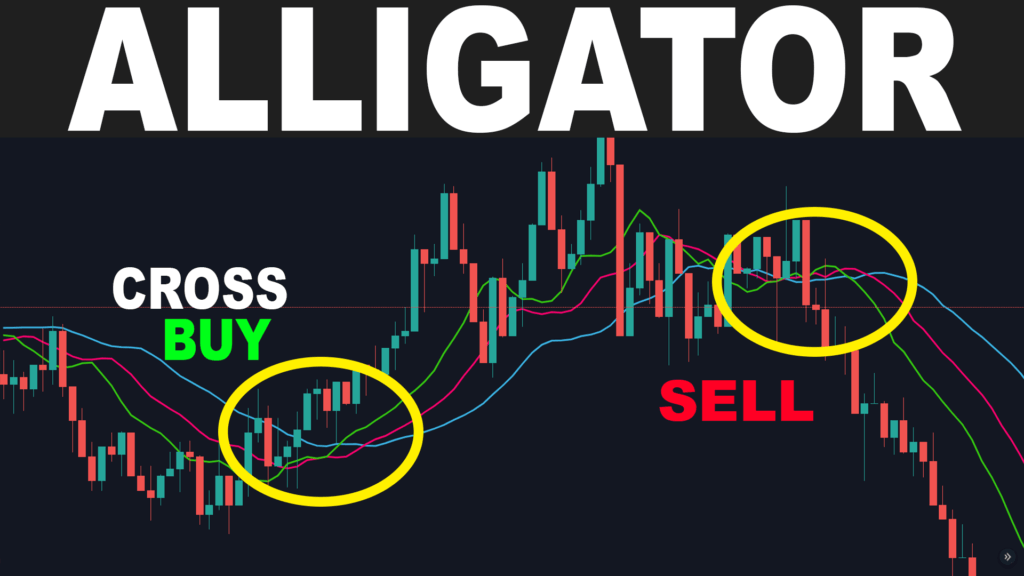
If the market is in a range, and is barely making any big moves, it is a good indication that, there are no big market movers trading right now. You should avoid range, to not lose money.Number 2, Not looking at other moving averages at all.Just because a 20 period moving average indicates an up trend, doesn’t always have to mean the market is going to go higher. There maybe a 200 period moving average resistance above, and market may go in the opposite direction instead.
In this case, you will lose money. Some even blame the moving average, for not working properly.It is recommended. to at least use two moving averages on a trading chart! One should be 20 period Exponential Moving Average, and other Should be a 200 period Exponential moving average. 20 E M A, will show you the short term trend, and 200 E M A, will show you the long term trend. They both will acts as a support and resistance on a chart. It is a good rule of thumb, to use 200 period E M A, as your main trend indicator, to have a higher chance of taking trade in the right direction.Number 1 mistake new traders make, is to ignore other support and resistance. I’ve seen this so many times happen.
Just because moving average is showing an up trend, doesn’t have to mean that the market will go higher. There maybe a strong resistance upcoming, that may change the direction of the trend completely.If you see a strong support or resistance coming, you should wait, and see how other people react to it. Furthermore, market won’t always change direction, and give you an accurate pullback. therefore, to increase your winning, it is good idea to take trades, near support and resistance, other than the support of Moving average alone.
if you are a stock trader, you can even use VWAP. VWAP indicator is really important, and will increase your chances of winning even more. I will make a video on VWAP soon.
Maybe Subscribe to see it! Like the video if you liked it, and Subscribe for more.
Read more
Want To See My 4 Steps 77% Win Rate Trading Strategy? (With Data)

See What I'm Trading Right Now?
1. Price Action Series (43mins)
2. Trading Foundation Series (1 hour)
3. How I Made 100% Profit In A Year (2 hours)
so You can Increase Your Win Rate!


Want To See My 4 Steps 77% Win Rate Trading Strategy? (With Data)
See What I'm Trading Right Now?
1. Price Action Series (43mins)
2. Trading Foundation Series (1 hour)
3. How I Made 100% Profit In A Year (2 hours)
so You can Increase Your Win Rate!

- Tags best crossover, best share market strategy, crossover, day trading, ema, exponential moving average, forex, forex market, intraday crossover, intraday strategy, intraday trading, market, mistakes, moving average, moving average crossover, moving average crossover strategy, Moving Average Trading Strategy, moving averages, moving averages crossover, moving averages forex, sma crossover, stock market, stocks, strategy, swing trading, trading, trading strategies, trading strategy
Does MACD trading strategy even work? Are online trading guru’s telling you fake information? I have wasted years testing every trading strategy out there before i found the right one that worked! I’ve created this channel to expose every strategy and show their real probabilities so you don’t have to waste your precious time like i did! I’m not here to sell any kind of online course I’m just here to help you in your Stock trading and Forex trading career. if you find this video helpful consider subscribing to support the channel!
In this video i will back-test 100 times a very famous trading strategy called MACD cross over. Yes you heard it right. testing 100 times takes time and will most likely prove if you should risk your hard earned money using this strategy!
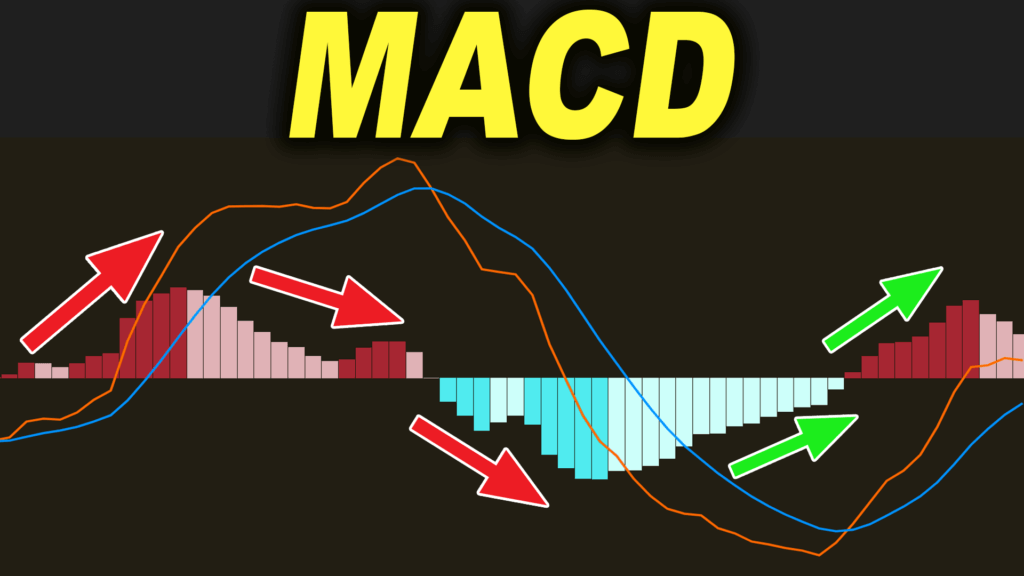
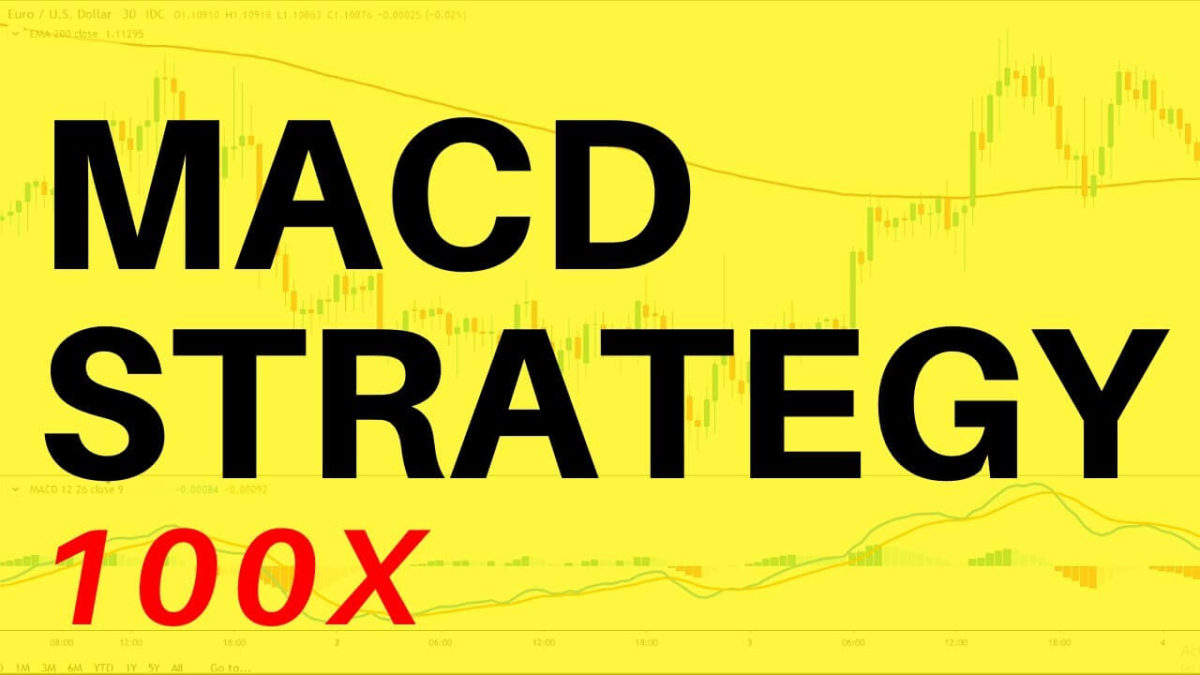
For those who are new to trading in late 1970s Gerald Appel created an indicator called MACD! MACD short for moving average convergence divergence is a trading indicator used in technical analysis of stock prices and can be applied on a Stock trading or Forex trading chart. This is what MACD indicator looks like. by default MACD indicator will come with 2 lines! a blue line called MACD and a red line called the signal line! MACD crossover strategy is simple once the MACD line crosses above the signal line it is considered as a buy signal. Furthermore you should only take buy signals that are way below the zero line of the histogram.
There is a big problem with this trading setup! there is no way to identify a good direction of a trend using MACD indicator alone. To be a profitable trader as a beginner you should always trade in the same direction as the market is trending. So to identify the trend we are going to use 200 period Exponential Moving Average! If the market is above 200 E M A it is considered as an up trend. Remember only buy when the MACD gives a buy signal and the market is in an up trend.
Here’s an example of a buy setup. the market is above 200 E M A so it’s an up trend. the MACD is showing a crossover below zero line of the histogram. In this buy setup entry is at the MACD crossover and the stop loss is below the pullback of the trend. your profit target should be more than the risk you are taking on the trade. so if you lose one and win one you will still be in profit. there are different ways to set profit targets. personally i will take 25 percent off the trade when the trade reaches 1 times the risk and will move the stop loss to break even. then i will set a second profit target of 2 times the risk i originally took on the trade. so even if the trade never reaches my second profit target i have already taken 25 percent off the trade in profit and will not lose money.
Here are some more buy setups in the same trend. all three were in profit. the third trade is also a winner as the market first went up towards the profit target and then went down. but wait!!! Don’t get excited by seeing these 3 winners in a row. this doesn’t mean the strategy is profitable at all. just because i showed you a hand picked buy setup that had 3 winners doesn’t prove anything. who knows if this strategy will have 5 or 10 losers in a row next. unfortunately many trading youtubers on YouTube will show a hand picked setup like this to earn trust of the viewer to sell them a paid course. they won’t mention what’s the probability of the strategy so you can manage money and not blow up your account. trading is a probability game. if you are not back testing the strategy at least 100 times you will have a difficult time with trading or maybe will never make money. that’s why I’m here! reason why i created this channel is to show you the real probability of any trading strategy out there. By knowing the probability of a trading strategy you can predict how many losers and winners you can have in a row and manage your risk per trade accordingly!
In this next few minutes i will show you how the profit graph looks like after taking 100 trades. and how much is the winning percentage of MACD crossover strategy and how many losers you can expect in a row. i will fast forward the next clip to save your time. the following clip can help you understand how this strategy looks in different market condition so do watch carefully.
For back testing i have used Euro USD chart but i later switch to Euro JPY. This strategy works on any time frame and also works on both forex and stock markets. Here I’m using 30 minutes time frame. I’m also taking sell setup in this example. strategy for sell setup is very similar to buy setup. In buy setup we buy when MACD crosses above signal line and the MACD crossover is below the zero line and market is above 200 Moving Average. For sell setup sell when market is below the 200 moving average and MACD line crosses below the signal line and the MACD crossover is above the zero line of the histogram. sell setup is just opposite of buy setup.
You can see how the win rate and profit graph changes as i take more trades. at one point the win rate almost reached 70 percent which is wrong! the real win rate will be revealed when we reach 100 trades or more. As i mentioned there are different ways to set profit target. here in this example profit target was set 1.5 times the risk i was taking. you should always take profit more than the risk you are willing the take!
As you can see on the left for back testing i’m using 10000 as my starting balance. Also i’m only risking 1 percent of my account balance on a single trade. you should only risk 1 to 2 percent of your account on a single trade. otherwise it will be difficult to handle losing trades that will come in a row. money management is the key to success in this business! in this example. when i lose i only lose 100. but when i win i win 150. so even if i lose one and win one i will still make money.
You can see how market bounces back from the 200 moving average that’s because 200 moving average acts as a support and resistance. there are many other strategies around different moving averages if you like to see them tested maybe leave a like on this video and subscribe to support the channel! some strategies work on intra day only and some work better on daily time frame. this strategy however works on all time frames. further more MACD is a leading indicator so it won’t give you late entry signals like most other indicators do.
If you are paying attention you should have noticed i added 3 zeros in the profit column instead of 150 or -100. that’s because during the back testing i found 3 trades that had confusing entry. the entry signals were not clear. that’s why i didn’t take them. if the signals are confusing do not take trades. you can always find more good trades in the future instead of losing on that one bad trade.
with only around 35 trades win rate is around 66 percent. but like i said this win rate is wrong. you will see how the win rate changes as we reach 100th trade. I’m going to fast forward this clip even more to save your time and so we can all see how much money we make in the end.
if you would still like to see every trade slow down the video by changing the video speed on youtube. set it to something like 0.25
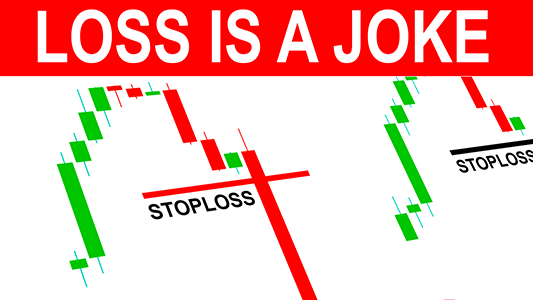
it took me around 1 hour to back test 100 trades. and while testing some trades almost came close to hitting the stop loss before going back and hitting profit targets. don’t panic when market is very close to hitting your stop loss. losing is part of trading. whole point of making this video was to show you the number of losers you can have in a strategy. No strategy works 100 percent of time. Even professional traders use strategies that only work 60 to 65 percent of time. the key to make money is money management and trading psychology! master that and you can become a professional.
Here are the results of the 100 trades.
as you can see the win rate of this strategy is approximately 62 percent. In this back test. I had 62 winners and 38 losers. I was able to win 9 trades in a row and lost 5 trades in a row. After 100 trades i was able to generate 50 percent profit. that is a really good profit! if you are a intraday trader and take around 30 trade in a month it will only take you 6 months to double your profit. that’s 100 percent profit gain in 6 months and in one year you will have 200 percent profit gain. even you don’t trade intraday and only take 15 trades a month you can make 100 percent profit in one year.
the reason i think people lose money is because they don’t know the win rate of their strategy. and when they don’t know the win rate they can’t predict how many losing trades in a row you can’t expect. they probably give up when they lose few in a row and blame the strategy. that was the point of making this video and help new traders to encourage them to back test. You can and should test this strategy on your own to have the confidence to execute trade with real money. good luck. some say that it is easier to win while back testing. As an experience trader who has been trading for years i see no difference. The people who say that don’t know how to back test. if you properly understand a strategy and have seen it perform well while backtesting you should not have any problem executing in open markets. but this strategy is not as important as money management.
Focus on that first if you are new. don’t risk more than 1 percent on a single trade. Subscribe to this channel to see more videos hit the like button if you found this helpful. and i will see you in the next video. this is the first video on this channel subscribe and ring the notification bell if you want to see more! good bye!
Read more
Want To See My 4 Steps 77% Win Rate Trading Strategy? (With Data)
See What I'm Trading Right Now?
1. Price Action Series (43mins)
2. Trading Foundation Series (1 hour)
3. How I Made 100% Profit In A Year (2 hours)
so You can Increase Your Win Rate!
Want To See My 4 Steps 77% Win Rate Trading Strategy? (With Data)
See What I'm Trading Right Now?
1. Price Action Series (43mins)
2. Trading Foundation Series (1 hour)
3. How I Made 100% Profit In A Year (2 hours)
so You can Increase Your Win Rate!
- Tags best, crossover, day trade, day trading, day trading strategy, forex, how to, how to trade, indicator, intraday, intraday strategy, intraday trading, live, live trading, macd, macd crossover, macd strategy, macd trading, macd trading strategy, macd trading strategy forex, market, money, moving average convergence divergence, stock, stock market, stocks, strategy, swing, technical analysis, trade, trading, trading strategies, trading view, tradingview, tutorial